Find Statistically Significant Modifications with Limelight
This tutorial covers how to use Limelight to compare the results of two searches (treated and untreated) to find the modifications with the most statistically significant differences (in terms of their spectral counts) between the two conditions. This is the method employed in the following publication:
This tutorial will assume the user has completed our Magnum Pipeline Tutorial
to generate a treated.limelight.xml file, and has completed the optional step to produce the
untreated.limelight.xml file.
Upload Data to Limelight
Although uploading data is covered in our Magnum Pipeline Tutorial, we will
repeat those steps here. If you have already uploaded your treated.limelight.xml and untreated.limelight.xml
files to Limelight, skip this step.
Note
If you are using Windows, this step is greatly simplified by first copying your Limelight XML files to a Windows filesystem drive, such as
C:\. To copytreated.limelight.xmlanduntreated.limelight.xmltoC:\data_directory\you would enter the following into your terminal.cp ~/my-project/treated.limelight.xml /mnt/c/data_directory/treated.limelight.xml cp ~/my-project/untreated.limelight.xml /mnt/c/data_directory/untreated.limelight.xml # Optional: You must upload your mzML files to view spectra. Copy to C:\ for upload later cp ~/my-project/treated.mzML /mnt/c/data_directory/treated.mzML cp ~/my-project/untreated.mzML /mnt/c/data_directory/untreated.mzML
/mnt/c/corresponds to yourC:\drive./mnt/d/corresponds to yourD:\drive, and so on.
Steps to upload your data to Limelight:
Log into Limelight
Navigate to an existing project or create a new project.
Scroll down to the
Upload Datasection and click the arrow on the left to expand the section.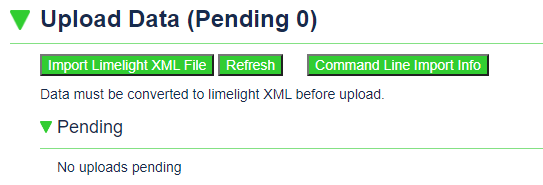
Click the
Import Limelight XML Filebutton. You should see the following dialog appear: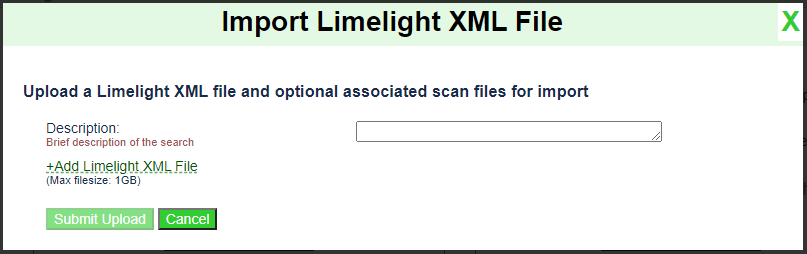
Enter a description of this run. E.g.,
Treated.Click on the
+Add Limelight XML Filelink and select yourtreated.limelight.xmlon your computer.(Optional) Click on the
+Add Scan Filelink and select yourtreated.mzMLfile on your computer. This is required if you would like to view spectra associated with peptide identifications.Click the
Submit Uploadbutton to submit your data to Limelight.Repeat steps 4-6 for your
unreated.limelight.xmland, optionally, youruntreated.mzMLfile.
After several minutes, refresh the page and your searches should appear under the Explore Data section
of the project page.
Navigate to the Mod View Page
Once your data are imported, the searches will appear under the Explore Data section:
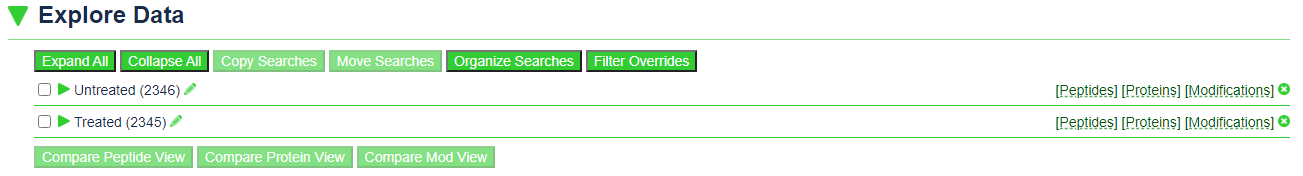
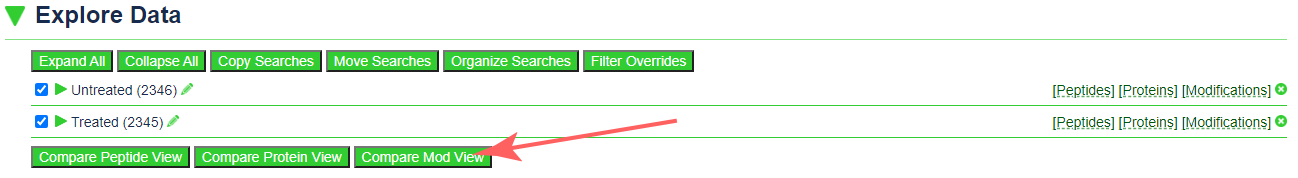
You will see your two searches listed here. To find the modifications with significantly different
spectral counts between the searches, click the check box next to each search and click the
Compare Mod View button:
Change Visualization Options
By default the mod page will show the following:
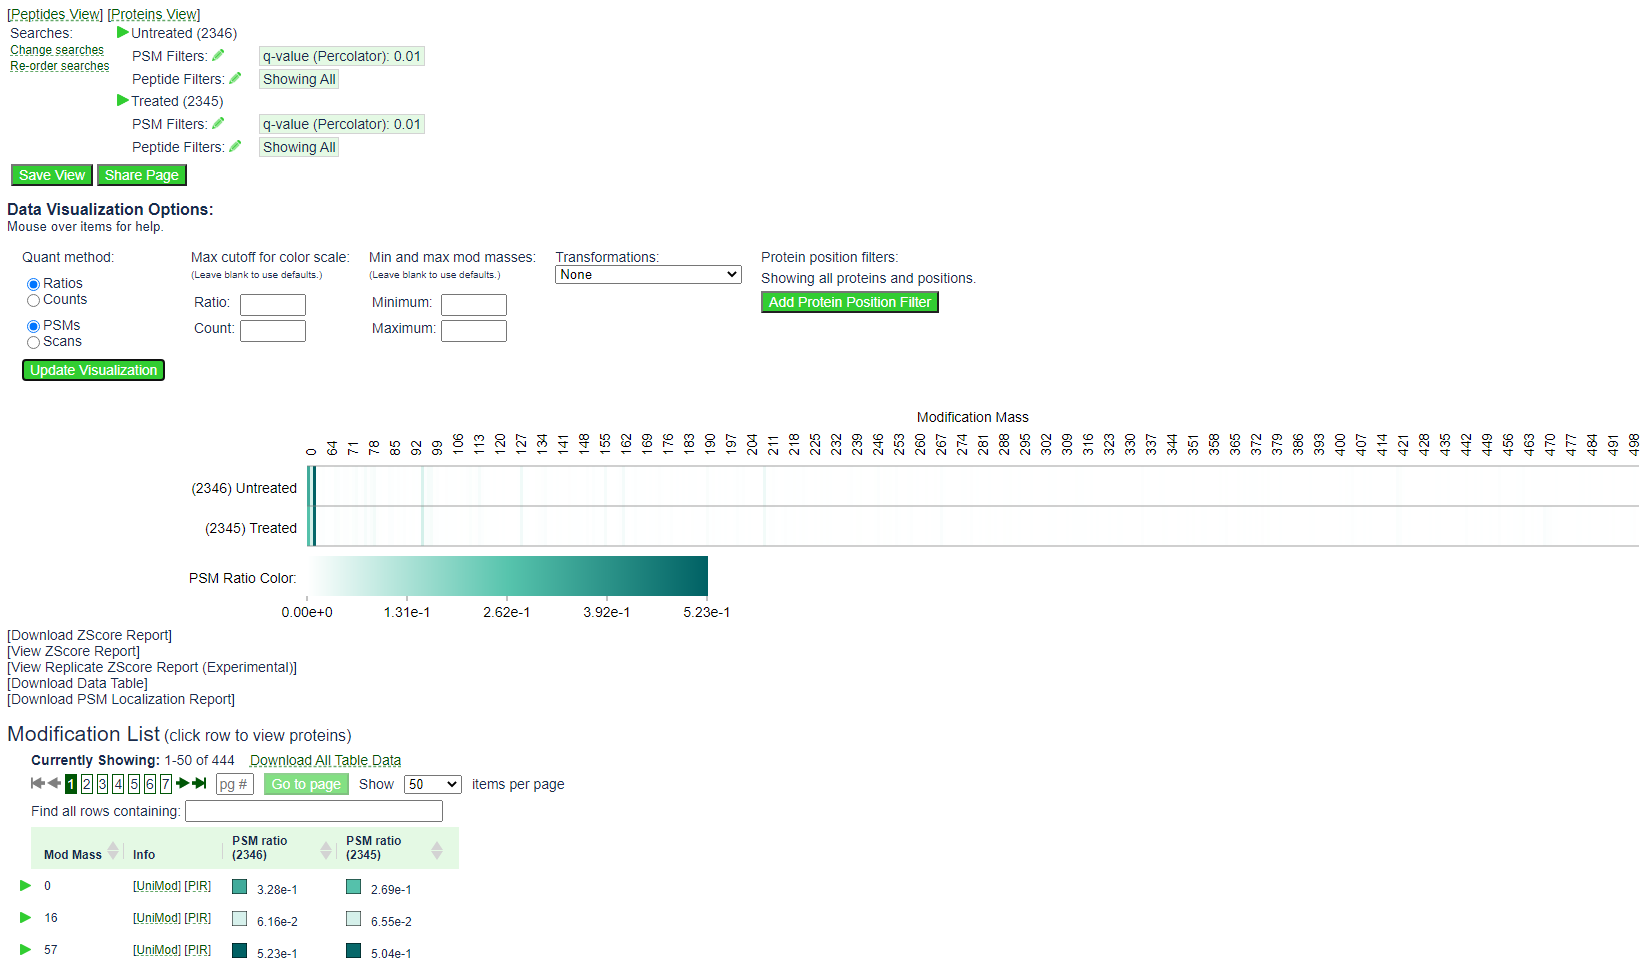
The heat map shows the spectral count for all PSMs with a given mod mass in each of the two searches. In this example, the spectral counts for 0, 16, and 57 are drowning out the signal for the open modification masses, which will have a modification mass of 60 or higher.
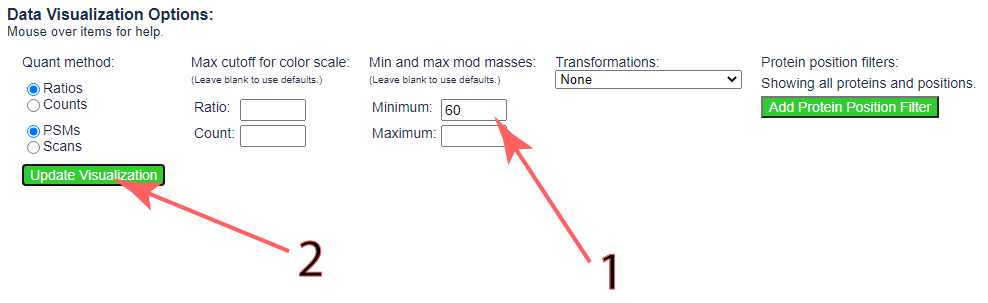
To restrict the mod masses to those with a mass of 60 or higher, change the minimum mod mass to 60 and click the
Update Visualization button, as depicted below:
The page should update to the following:
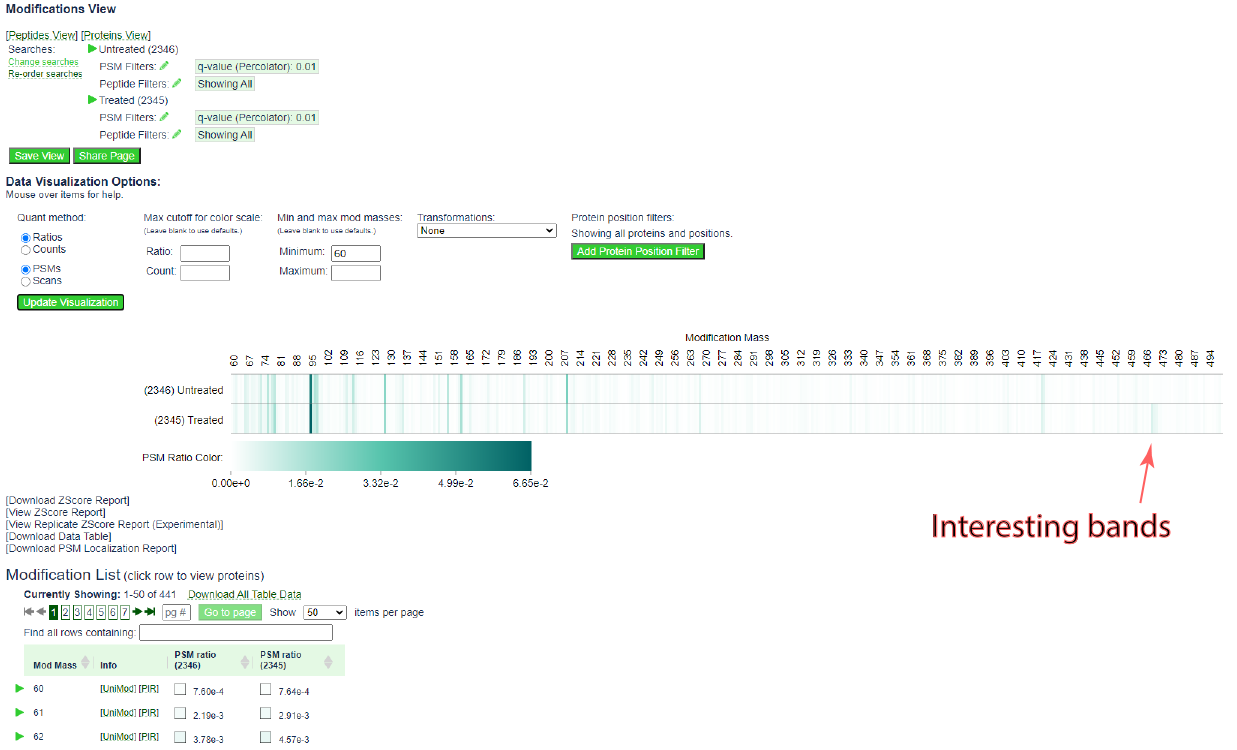
The heat map is more informative. Note the bands that appear near 470 in the treated sample, but not the untreated sample.
Run the Report
To run a statistical analysis comparing the spectral counts for mod masses in the two searches, click the
View ZScore Report link below the data visualization:
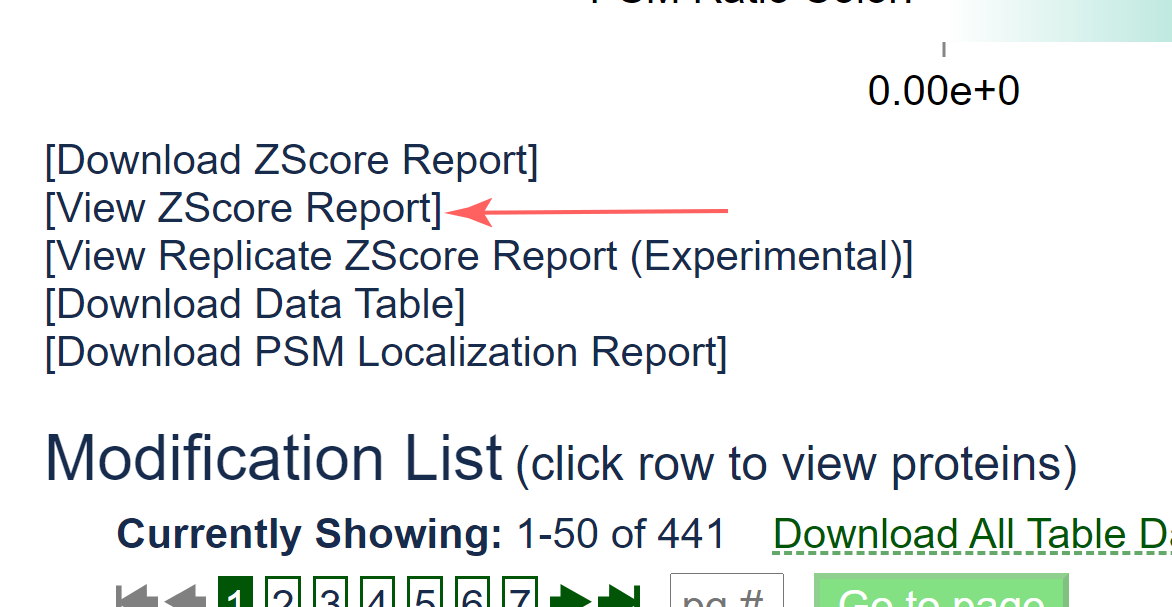
This will compare the ratio of PSMs that have a given mod mass to all PSMs in each search using a test for proportions and produce the following report:
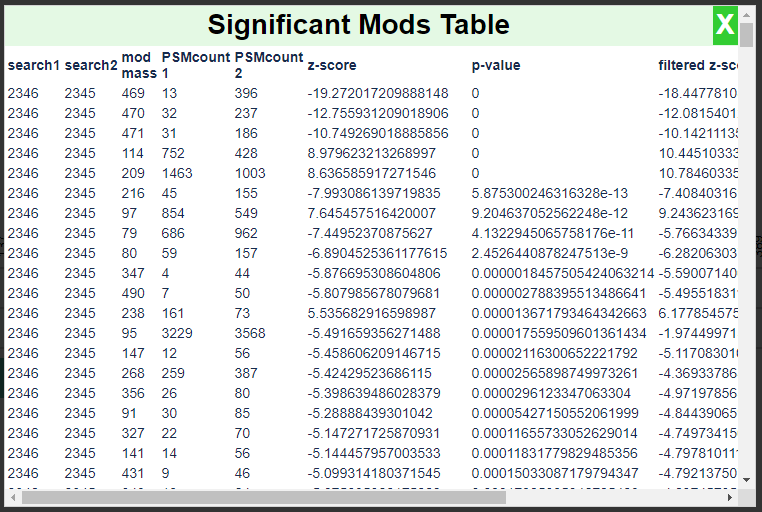
This report is ordered by the magnitude of the Z-score. Note that the modification masses 469, 470, and 471 have the most significant Z-scores. A negative Z-score in this case denotes enrichment in the treated sample.